What is a correct application? It is an application that compiles cleanly and that runs without errors. Rarely is an application truly correct because some bugs don't appear until late in the life of an application. Other bugs raise their ugly heads as soon as you press Enter after entering a program statement.
This lesson takes you on a tour of Visual Basic's debugging tools. With Visual Basic's integrated debugger as part of the development environment, you can test your applications and locate bugs. Your goal should always be to eliminate as many bugs as possible. Although you cannot always ensure that every bug is gone, you can test your application to eliminate as many bugs as you can.
The highlights of this hour include
You already know that a bug is a program error. Several kinds of bugs exist, however. The kind of error that appears determines how you will fix the bug.
New Term: A syntax error is a bug that appears because you misspelled a command or used improper grammar.
Syntax errors are the easiest errors to remove from your program because Visual
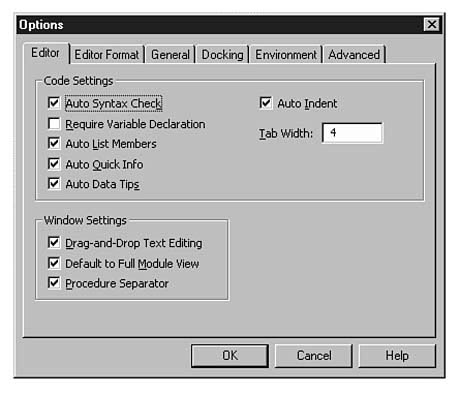
Basic finds them for you. Take a moment to display the Options dialog box shown in
Figure 20.1. (Select Tools | Options to see this dialog box.)
Figure
20.1. Letting Visual Basic find syntax
errors for you.
The option labeled Auto Syntax Check turns on and off Visual Basic's automatic detection
of syntax errors as you type them. In other words, if the option is set, and you
type a statement but type a syntax error, the Code window will look over your shoulder
and inform you immediately of the error.
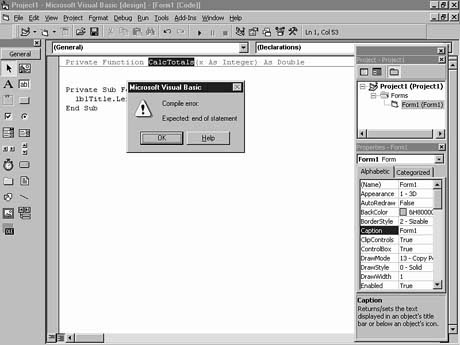
Notice what happens in Figure 20.2. The programmer was trying to enter this statement:
Private Functiion CalcTotals(x As Integer) As Double
Although it's fairly obvious that the programmer misspelled Function, and it's obvious that the Code window noticed something wrong, here are two things to notice about this automatic syntax check:
Figure
20.2. Visual Basic detected the
syntax error.
The error message that appears rarely reads Syntax error because several
kinds of syntax errors can occur. The error message Compiler error is less
informative than some of the others, but the actual error is secondary to the fact
that you typed something incorrectly. Perhaps you misspelled a word (true in this
case), left off a quotation mark or a right parenthesis, forgot a built-in function
argument list, or failed to end the statement with an underscore when you meant to
continue the statement on the next line. Therefore, when typing code and such an
error message box appears, look back at the statement to find the error.
Often, but not always, Visual Basic will highlight the offending part of the statement. In this case, however, Visual Basic failed to locate the exact error. Instead, Visual Basic highlighted the first word found after the error. Visual Basic cannot always detect the exact location of the syntax error because Visual Basic often has to interpret more of the statement before a problem becomes obvious. Therefore, if you don't see a problem with the current highlighted word, look back a word or two, and you'll find the mistake.
TIP: If you don't understand the error message itself, press F1 or click Help at the error message box to read what the online help has to say about the error message.
New Term: A runtime error shows up during the program's execution.
As you can see, syntax errors are the easiest kinds of errors to find. They either show up as you type the program code; or if you've turned off the automatic syntax error check, the syntax errors show up when you try to run or compile the program. Another kind of error, a runtime error, will not show up until you execute the program.
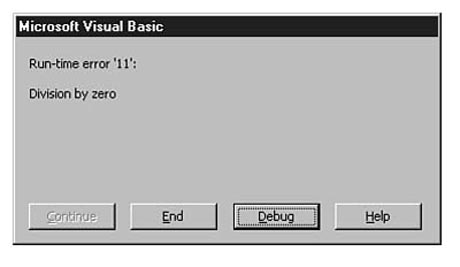
For example, suppose you were calculating an average salary figure, but you made
a mistake in the calculation and attempted to divide the total by a variable with
zero in it. Division by zero is undefined in mathematics (undefined for the real
number system, to be exact), but Visual Basic cannot, when you write the code, know
what value the variable will hold. Therefore, only at the time of execution when
the division is about to take place can Visual Basic recognize that the division
is impossible. Visual Basic will display a runtime error message box such as the
one shown in Figure 20.3.
Figure
20.3. A runtime error occurred.
When you're faced with a runtime error, the dialog box gives you these choices:
The Continue command button is rarely available because of the severity of most runtime errors. However, with the built-in debugging tools that Visual Basic makes available when you click Debug, you may possibly fix the problem and then continue with the program by clicking Continue. You'll learn all about the debugger in the next section.
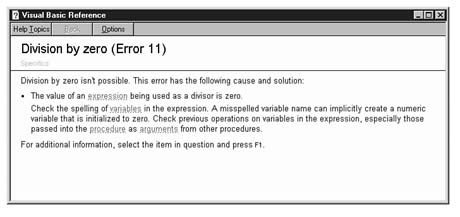
If you click End, the program will stop and you'll return to the Code window, where you can locate and fix the problem if you don't need help from the debugging tools. If you want to read more information on the error message itself, click Help to display online help. Figure 20.4 shows the online help that appears when you click Help on the divide-by-zero error.
New Term: A logic error produces bad program results, but no error messages appear.
Sometimes you tell the computer to do something that is wrong. The computer understands
your instructions because no syntax or runtime errors appear, but the computer simply
does not do what you want it to do. In those cases, you've programmed a logic error.
Figure
20.4. Visual Basic explains the error
message.
NOTE: If you've heard people say, "The computer made a mistake," that mistake was most certainly a programmer's or data-entry person's error. In most situations the computer simply does what it was told to do. When the computer zeros out a balance incorrectly, that error is almost always a programmer's logic mistake.
Logic errors are the most difficult to locate. Whereas the Code window tells you where a syntax error appeared, and whereas the runtime system tells you when a runtime error appears, you must spot logic errors yourself (hopefully before your application's users spot them) and trace the problem source. The development environment's integrated debugger is the most useful tool for finding logic errors.
TIP: One of the quickest ways to locate logic errors early is to test your program. When asked for an input value, enter extremely large and extremely small values. Run the application several times, using a series of test data values. If logic errors exist, such testing will almost always make the logic errors surface. Once you find all the logic errors, let other people run the program! They can also find problems that you failed to uncover because they will try things you never thought to try.
The debugger gives you a way to search your program's runtime details, interactively, looking at variables and trying new values all along the way. The debugger is the integrated tool that helps you find program bugs.
New Term: A breakpoint is a halting point in a program; when you run the program, the program executes as normal until a breakpoint is reached, at which time Visual Basic places you in the debugger.
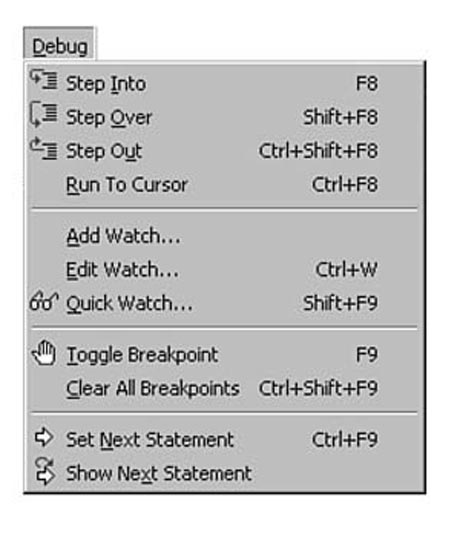
Visual Basic's Debug menu, shown in Figure 20.5, gives you a good introduction
to the debugger's capabilities. Look through the menu and find the Toggle Breakpoint
option. Breakpoints provide you the time needed to hunt bugs during the application's
execution.
Figure
20.5. The Debug menu is ready to help
locate bugs.
WARNING: Perform all your testing and debugging from within the development environment. Don't compile a program until you remove all the bugs (or until you believe you've removed all of them...your users will let you know soon enough if any still exist!). The debugger's facilities are available only from within the development environment.
Visual Basic enters the breakpoint mode (sometimes called the break mode) when you halt a program during execution or when execution reaches a breakpoint that you added to the program before you ran it. The Debug menu options are available during the application's breakpoint mode. These are the three modes that a Visual Basic program can be in:
Visual Basic tells you which mode is current by displaying the words design, run, or break in the title bar at the top of your Visual Basic screen. When you develop the program, the program is in design mode, as indicated by your title bar; when you or the user runs a program, the program is in the run mode; when you halt a program to use the debugger, the program enters the break mode.
The rest of this lesson is about the break mode. While in break mode your program retains all variable and control values. Therefore, you can halt the program at any time and look at data values from any line of the code. By comparing the values with what you expect the values to contain, you can find where problems are taking place.
You'll always enter break mode from the runtime mode. Only after you begin a program's execution will the break mode be available, because only at runtime are the variables and controls initialized with values. Here are the ways that you can move from runtime mode to break mode:
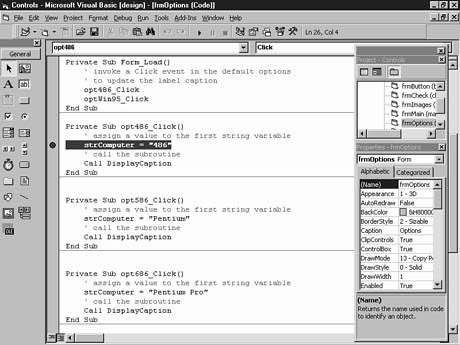
The most accurate and common way to enter break mode is by setting a breakpoint. To set a breakpoint, find the line where you want execution to halt at a breakpoint and set a breakpoint at that particular line of code. The following steps walk you through setting a breakpoint:
strComputer = "486"
Figure
20.6. The breakpoint line is highlighted.
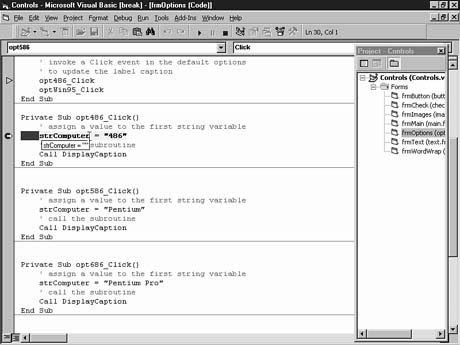
The program appears to run as usual. The opening dialog box appears. Click the command
button labeled Option Buttons to see what happens when execution reaches the breakpoint.
The execution continues, as usual, as long as the breakpoint is not reached, but
when the breakpoint line is reached, execution halts.
NOTE: Notice the title bar that now reads break before the form name. The title bar shows you that the debug's break mode is in effect.
As soon as Visual Basic reaches a breakpoint's line, Visual Basic enters break mode before executing the breakpoint line. The option button practice form is now in effect after you click the Option Buttons command button label's caption. The opt486_Click() event procedure assigns a string literal to a string variable and then calls another procedure to load that variable into a label. The breakpoint that you set occurs in the middle of the assignment code.
Follow these steps to see what kinds of things you can do at a breakpoint:
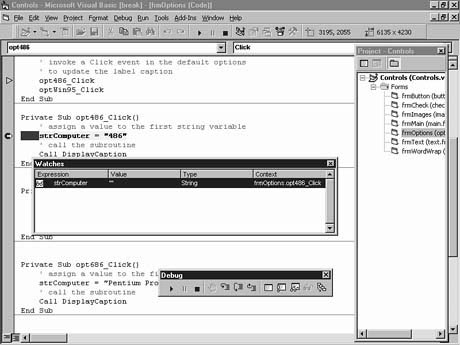
Figure 20.7. Looking at the variable's null value.
Figure 20.8. Looking at the variable's null value.
New Term: When you single-step through code, you execute subsequent program instructions, one statement at a time, looking at values and testing the logic as you go.
One of the most powerful debugging features is the single-step feature mentioned at the end of the previous section. At the breakpoint you set, only one additional statement (other than remarks, which do not execute) resides in the procedure, and that statement is a procedure call to another procedure named DisplayCaption().
The Debug menu's Step Into option (also available on the Debug toolbar) executes each statement in the program, including all the statements in procedures called . Therefore, if you single-step through the code from the breakpoint, the DisplayCaption() procedure executes (you can follow the yellow highlight to see the execution). After you step through the DisplayCaption() procedure, control returns to the opt486_Click() procedure that called DisplayCaption(), and then you can single-step back to the procedure that called opt486_Click().
If you want the effects of the single-step without going through every line of code, you can select the Debug menu's Step Over option. The Step Over option will not single-step through subsequent procedures called but will run each call individually without single-stepping through the lines in the procedures. In other words, you can single-step through the next subroutine procedure's Call statement (or function call), but when you then single-step, control does not go into that procedure; the procedure executes like normal and then you get the single-step control back again. The Step Over option is useful when you've debugged procedures called by the current procedure and you don't want to waste additional time single-stepping through a procedure you've already debugged.
TIP: The Step Over option is very useful when a procedure calls, in a loop, another procedure several times. The first time through the loop, you may want to single-step through the called code. In subsequent loop iterations you may want to select Step Over; the code inside the procedures executes but you won't wade through it line by line.
The Debug menu's Step Out option executes the rest of the current procedure without executing the procedure in single-step mode. Once the current procedure finishes and control returns to the procedure that called the current procedure, execution begins once again in single-step mode.
NOTE: During the line-by-line execution, you can place additional breakpoints. Every time you click on a line and press F8 (to toggle the breakpoint), Visual Basic adds a new breakpoint to the line. Therefore, a program may contain multiple breakpoints. In subsequent executions, you can run the program until it gets to a breakpoint, analyze values, click Start to run the program to the next breakpoint, analyze values, and so on. The breakpoints, therefore, help you get to the problem areas quickly without stepping through the rest of the code.
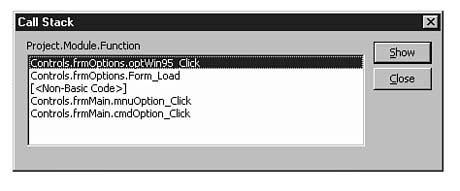
At any point during the debugging session, you can click the Debug toolbar button's
Call Stack button to display Figure 20.9's Call Stack window.
Figure
20.9. The Call Stack window lists all
called procedures.
The Call Stack window shows where your program execution has traveled. In addition, any non-Visual Basic routines, such as Windows routines that sometimes take over, appear in the Call Stack window. The call stack keeps a running list of all procedures executed, even if the same procedure executes multiple times.
TIP: Inside the debugger's break mode you'll only see the Code window and its related Debug windows that you display. If you want to see the program's actual output, press Alt+Tab to switch to the application's running window.
Suppose that a variable contains an incorrect value but you're not exactly sure where the error is occurring. You could set a breakpoint at every line of code that changes the variable. When you run the program, you'll look at the contents of that variable before and after each breakpoint's line of execution. If the first breakpoint seems to initialize the variable properly, you don't have to single-step through the code until the next breakpoint is reached. Instead of single-stepping, you can select Run Continue or press F5 to return the execution to its normal runtime (and real-time) mode. When Visual Basic reaches the next breakpoint, the code halts at that next breakpoint and you can continue to examine the variable.
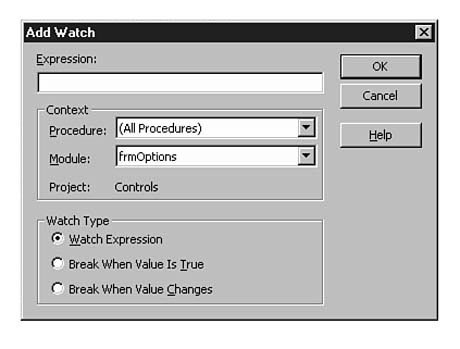
At a breakpoint, you can add not only variables but Watches window expressions
as well. Suppose that a variable is to maintain a count of customers but somewhere
in your code a negative value appears in the variable. If you added a watch expression
such as intCustCnt < 0 to the Watches window (right-click the window
and select Add Watch to display Figure 20.10's Add Watch dialog box) and clicked
the window's Break when Value is True option button, you could then run the program
and Visual Basic would enter break mode at any line that caused the variable to become
negative.
Figure
20.10. Watching for expressions as well
as variables and controls.
The breakpoints and watch dialog boxes that you can request while debugging your code give you tremendous power in analyzing variables and watching for specific results. You can look at the contents of variables and controls to make sure that data is being initialized the way you expect. Also, the Add Watch dialog box lets you set up expressions that Visual Basic watches for during the program's execution. If the values of those expressions ever become true or change, Visual Basic halts the code at that line and lets you analyze values using the Watch window.
At any breakpoint you can select View | Immediate Window (Ctrl+G) to request the Immediate window (sometimes called the Debug window). The Immediate window is a special window in which you can directly type Visual Basic commands and view and change variables and control values during a program's execution.
For displaying variables and controls, apply the Print method (see Hour 16, "Printing with Visual Basic") to view variables and controls. When you use Print in the Immediate window, Visual Basic sends the output to the Immediate window and not to the Printer object, as you saw in Hour 16. For example, suppose that you set a breakpoint during a variable's assign- ment, as described in the previous sections, and you pressed Ctrl+G to open the Immediate window. The Immediate window recognizes simple Visual Basic commands and methods such as Print and assignment statements.
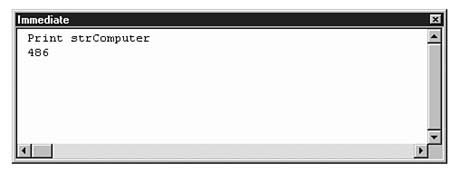
Figure 20.11 shows what happens if you print the value of strComputer
after the variable is assigned the string value. Unlike the Quick Watch dialog box,
the Immediate window has room to display multiple lines if you display a multiline
control such as a text box. You can resize and move the Immediate window. Although
they must use the Print command instead of simply clicking a variable or
control, many programmers prefer to display values from the Immediate window instead
of from the Quick Watch dialog box. The Immediate window displays the entire value
and contains a vertical scrollbar so you can scroll through the values printed in
the window.
Figure
20.11. The Immediate window displays printed
values.
The Immediate window's scrolling and resizing features are so handy that some Visual Basic programmers prefer to send messages to the Immediate window at runtime rather than use the Quick Watch dialog box. For example, if you want to see the value of certain arguments when called procedures execute, you can add the Print methods at the top of those procedures that send the argument values to the Immediate window automatically as the program executes. Once you get the bugs out of the program, you can remove the Print commands so that the Immediate window stays closed.
To print to the Immediate window, preface the Print method with the special Debug object. The following command, executed anywhere from an application's code, prints the values of two variables with appropriate titles in the Immediate window:
Debug.Print "Age:"; intAgeVal, "Weight:"; intWeightVal
All the Print method's options, including semicolons, commas, and Tab() and Spc() functions, work inside the Immediate window just as they do for the Printer object described in Hour 16. Be careful to specify the Debug object before the Print method, however. If you omit Debug, Visual Basic prints the output directly on the form itself!
The Immediate window recognizes assignments that you make to variables and controls. For example, suppose that you know that a certain variable wasn't initialized properly earlier in the execution but you still want to finish the program's execution as if the variable had its proper value. If you need to, you can assign that variable a new value directly within the Immediate window using the assignment statement. When you resume the program's execution, either in single-step or in runtime mode, the variable, from that point in the program, will contain the value that you assigned to it.
In this hour you have learned ways you can test and debug your applications. Several kinds of bugs exist and Visual Basic can find some bugs for you. Other bugs appear at runtime and they can be frustrating. Fortunately, the interactive debugger lets you step through your program one line at a time if needed, examining variables and controls to make sure that the expressions and input are as expected. Once you eliminate as many bugs as possible, you can then compile and distribute the code.
The next hour begins a new part of the book that teaches more advanced subjects. You will learn how your Visual Basic program can interact with other kinds of applications.
The quiz questions and exercises are provided for your further understanding. See Appendix C, "Answers," for answers.
Print lblFileName.Caption

Print intNumRecs, intNumFields

Print strCompName
![]()
![]()
![]()
![]()
![]()